Many of these graph's data was collected via a servey taken by 34 people. The data table and the first two graphs were taken from data collected from Pachamam, which is referenced on the APA page. The driving question for this part of the project is how upcycling effects the environment and the statistics of how many people actually upcycle.
Link to the survey.
Link to the survey.

This data table is connected to the graph below it. The table shows the amount of CO2 that is not admitted into the atmosphere compared to how many textiles are reused. For every 1 ton of textiles being reused, there is 20 tons of CO2 not being admitted into the air. CO2 is a greenhouse gas that when enough of it is admitted, it can keep the heat in. This is what can cause global warming, due to the heat being kept in the atmosphere, and by upcycling, this can reduce the amount of CO2 being admitted into the air.
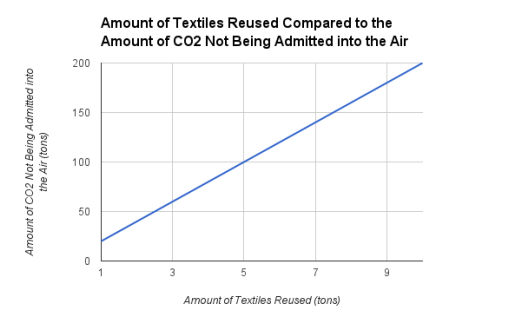
This graph shows how much CO2 that is not admitted into the atmosphere compared to how many textiles are being reused, though upcycling. For every 1 ton of textiles being reused, there are 20 tons of CO2 not being admitted into the atmosphere.
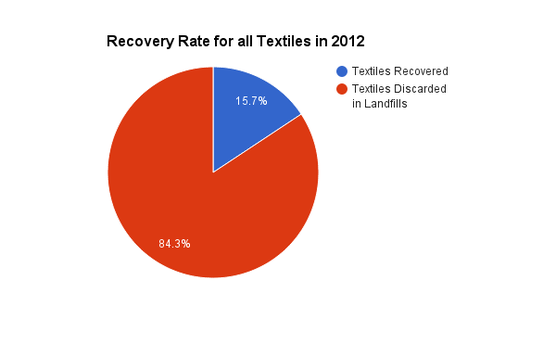
This graph shows the recovery rate of all textiles in 2012. It's estimated that about 2.3 million textiles were recovered, but that is only 15.7% of all the textiles. About 33.81 million textiles, the 84.3%, ended up in landfills. The amount of textiles that did get discarded into land fills is 14.7 times larger than that of the recovered textiles.
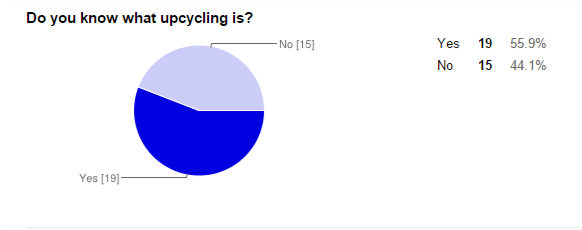
This graph shows that more than 50% of the population that took this survey do not know what upcycling is. Only 44.1%, or 15 people, know what upcycling is without a description, which the people who said "no" got after this question. This helps to shows that, if this was spread out to the whole population, only about 44% of the population would know what upcycling is. If people don't know what it is to upcycle then they may not know if they like it, due to it being one of the most creative ways of saving the environment.
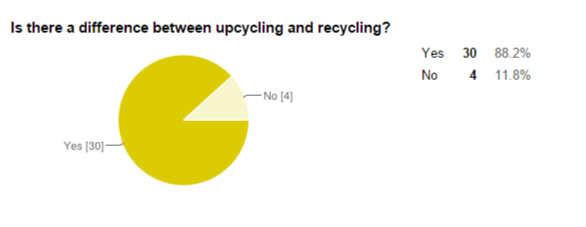
This graph shows that more people know, or think, that there is a difference between upcycling and recycling. The percent of citizens who know/think that there is a difference between upcycling and recycling is 88.2%, while the percent who don't is at 11.8%. This is important because there is a difference between upcycling and recycling, one being more citizen engagement.
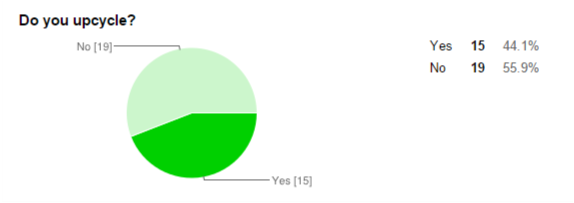
This graph shows how many people who took the survey upcycle, that number being 15 or 44.1%. This is important because it shows that less than half of the population is taking the opportunity to save the environment in a creative way, whether creative or not. These numbers could be skewed due to the fact that people may be doing something other than upcycling to save the environment.
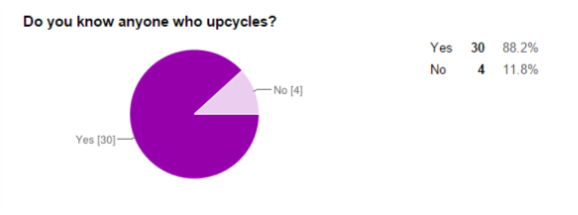
This graph shows whether the person who took this survey knew a person who upcycles or not. Surprisingly, more people know someone who upcycles rather than themselves upcycling. The percent of people who know someone who upcycles ins 88.2%, while the percent who upcycle themselves is only 44.1%. This is important because with the amount of people who upcycle being lower than those who do not can be a bad sign, but with the amount of people knowing another person who upcycles is a good sign.
